Tagged: India Market, Stock Charts, US Market
- This topic has 1 reply, 2 voices, and was last updated 4 years, 7 months ago by
 Binoy Das.
-
AuthorPosts
-
September 28, 2021 at 7:40 pm #12898
 boringinvestorModerator
Performing technical analysis is much easier when you use a great stock chart. You Stock broker must have provided you with some tools already but if you are still in the learning process and do not have access to these tools then, here are some FREE websites to practice-
1. TradingView

TradingView offers the ultimate clean and flexible experience for looking at stock charts. TradingView stocks charts are community driven to provide technical analysis in the form of optional annotations on each chart. Community aside, TradingView also supports extensively detailed charts, not too mention better valued pricing than StockCharts.com for those who want access to advanced features and/or real-time data.
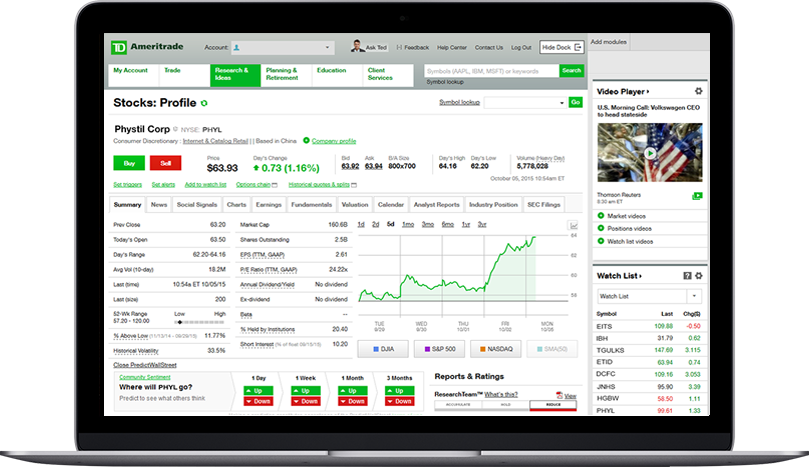
2. TD Ameritrade (US Stocks Only)

TD Ameritrade is a full-service online broker that is best known for its trader technology. I’ve had an account for well over a decade and love their charting package included with the thinkorswim desktop platform, which was ranked first overall by StockBrokers.com in their 2021 Broker Review. There is no minimum deposit to open an account and download the trading platform. Whenever you are ready to trade, just fund your account. TD Ameritrade charges $0 for everyday stock and ETF trades.
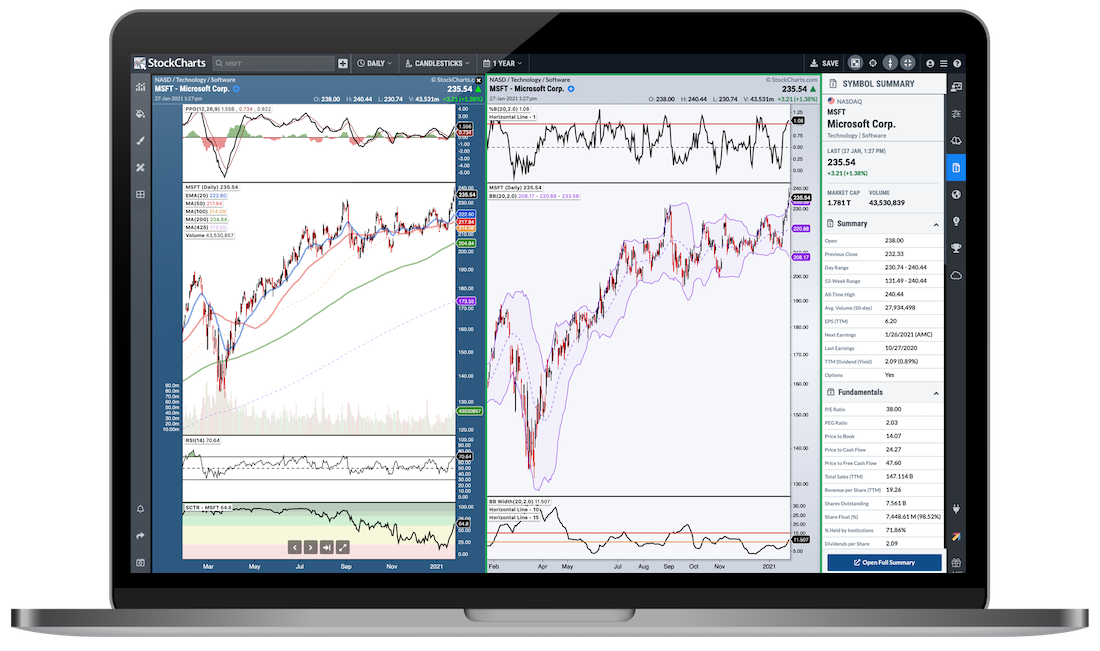
3. StockCharts.com

StockCharts.com offers casual traders simplicity, cleanliness, and overall scalability. Behind TradingView, it is the most widely utilized free stock charting site for financial bloggers. StockCharts.com offers a wide variety of different free tools and ways to analyze any stock chart. For investors who want historical charting and further analysis, they can upgrade to a paid subscription.
4. Yahoo Finance

Yahoo Finance upgraded its entire charting experience in the Spring of 2019. Today, Yahoo Finance offers clean HTML 5 charts that are clear, easy to use, and ideal for everyday investors. Yahoo Finance is also an excellent website for stock quotes, research, and news (less the annoying ads). Unfortunately, the new charts restrict advanced features like key event overlays, requiring a subscription to Yahoo Finance Premium for $34.99/mo.
5. Google Finance

Google Finance provides a very simple charting solution for investors. What makes Google’s charts so nice is the ability to just Google search for the ticker and instantly have a simple chart pull up. For example, try Googling, “TESLA stock chart”.
In addition to these, I would ask all community members to share other free resources with the community.
Your participation matters!
September 29, 2021 at 4:29 am #13124Binoy DasParticipantThank you for sharing this. I have been using Zerodha for most of my analysis, gets monotonous at times.
-
AuthorPosts


You must be logged in to reply to this topic. Login here