
Ready to take your investment expertise to the next level? Financial ratios stand as invaluable tools to elevate your decision-making in the world of investing. In this blog post, we’ll uncover the ten essential financial ratios every savvy investor should have in their toolkit. This knowledge will empower you with a comprehensive grasp of assessing a company’s health and profitability.

The Context
Stock picking is a time-consuming affair — PlanB
The major drawback of being a retail investor is the absence of periodic advice about stock purchases and sales.

In fact, for certain people who enjoy taking risks without having a solid foundation or history, this lack of direction can be disastrous. Finding value investment prospects necessitates a thorough examination of financial stability, which is accomplished using a variety of instruments and methods. A popular method for identifying long-term investing opportunities is fundamental analysis.
Fundamental analysis is a rigorous and time-consuming process, therefore it occasionally becomes difficult to research many stocks and companies at once. When you merely need to rapidly examine a stock before going further with your study, this is very challenging. Financial ratio analysis is one of the main techniques included in Fundamental Analysis.
This method can quickly assist in determining the worthiness of a specific firm from the sea of potential investment options.
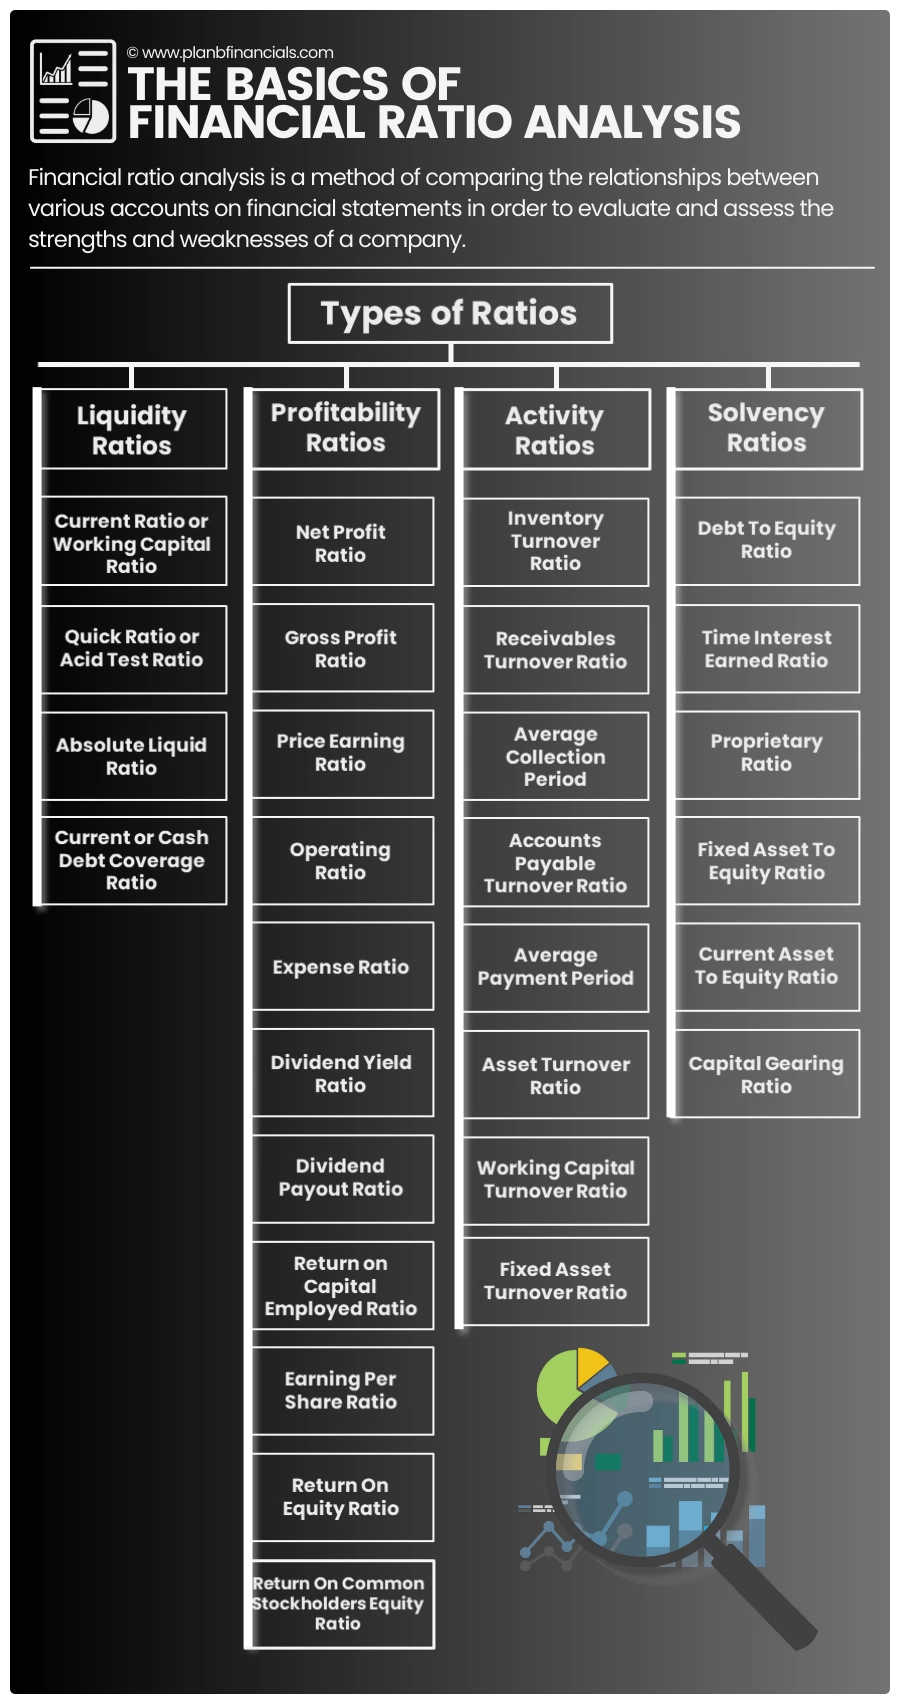
Financial ratios are brief, easy-to-understand pieces of financial data.
Ratio analysis is based on the fact that a single accounting figure by itself may not communicate any meaningful information but when expressed relative to some other figures may provide some significant knowledge. Understanding financial ratios is not just about comparing different numbers from the balance sheet, income statement, and cash flow statement.
It is about comparing the number against previous years, other companies, the industry, or even the overall economy in general for financial analysis. While basing all of your judgments on ratio analysis may not guarantee a stock’s future success, it is undoubtedly a great tool for assessing the general state of affairs.
🚨 Nerd Alert – This article’s information has been purposefully made simpler for users who do not have a background in finance.
The top 10 critical financial ratios that any self-directed investor has to be aware of are as follows:
1. Debt To Equity Ratio
One of the top-worthy financial ratios in the ratio analysis is equity debt. Uncertain times demand security and the safety of capital.
A company’s debt-to-equity ratio describes to what extent a company is financed by debt relative to equity. The debt-to-equity ratio is calculated by taking the sum of a business’s liabilities and dividing that number by the sum of its equity. The debt-to-equity ratio measures a company’s total debt relative to the amount originally invested by the owners and the earnings that have been retained over time (Equity).
The Debt to Equity ratio is the lower the better metric.
While there’s no set rule of thumb, this is a lower the better metric, especially for risk-averse investors. A lower debt-to-equity ratio usually implies a more financially stable business.
Investors are less likely to invest in a firm with a larger debt-to-equity ratio because they don’t want to be held liable for repaying the excessive debt if it can’t be covered by profits from the business.
For instance, a debt-to-equity ratio of 1 would mean that investors and creditors have an equal stake in the business assets. The ideal debt-to-equity ratio sometimes also varies depending on the industry because some industries use more debt financing than others. Capital-intensive industries like the financial and manufacturing industries often have higher ratios that can be greater than
2. Quick Ratio
Also known as the acid-test ratio, this ratio measures the ability of a company to pay all of its outstanding liabilities when they come due with only assets that can be quickly converted to cash. Assets that can be quickly converted into cash include the actual cash, cash equivalents, marketable securities, short-term investments, and current account receivables.
1 is often regarded as the ideal quick ratio. When a company has a quick ratio of less than 1, it has no liquid assets to pay for its current liabilities and should be treated with caution.
Since most companies use their long-term assets to generate income, selling them off not only seriously hurts the company but also shows potential investors that current operations are not generating enough profits to pay off current liabilities.
Current liabilities are a company’s short-term obligations that are due within one year or a normal operating cycle. When a company has a quick ratio of 1, its quick assets are equal to its current assets. This also indicates that the company can pay off its current debts without selling its long-term assets.
If a company has a quick ratio higher than 1, this means that it owns more quick assets than current liabilities.
The Quick Ratio is a higher the better metric.
It’s a higher the better metric but what’s to be noted is that a very high quick ratio is not always a good thing! It can imply that money has accumulated but is merely hanging around and not being appropriately used for investments or expansions.
3. Current Ratio
The current ratio is a more relaxed approach to determining a company’s debt-repaying ability. The current ratio is different from the quick ratio.
The main difference that lies between these two ratios is that while the current ratio is focused on all the current assets including inventory, prepaid expenses, etc., the quick ratio is focused more on items that can be immediately converted into cash as mentioned above.
The current ratio is a common measure of the short-term liquidity of a business. The ratio is used by many analysts to determine whether they should invest in or lend money to a business.
The Current Ratio is a higher the better metric.
As a common consensus, 2 is considered an ideal current ratio for an organization. In the case of banking institutions, 1.33 is considered to be an ideal current ratio.
The criteria that determine an organization’s optimal current ratio include its type of liquid assets and liabilities as well as the nature of its business.
4. Price To Book Value Ratio
This ratio is also referred to as the market-to-book value ratio, the P/B ratio compares the current market capitalization (equity value) to its accounting book value. Market capitalization depicts the pricing of a company’s equity according to the market. Or simply put it’s what investors currently believe the company to be worth.
The book value, on the other hand, reflects the value of the assets that a company’s shareholders would receive if the company was hypothetically liquidated.
The Price To Book Value ratio is lower the better metric.
It is a lower the better metric for investors but a higher the better metric for a company. It’s simply because any financially sound company would want its market value to be greater than its book value since equities are priced in the open market based on the forward-looking anticipated growth of the company.
While the norm for the P/B varies by industry, a P/B ratio under 1 tends to be viewed favorably by investors and as a potential indication that the company’s shares are currently undervalued. The P/B ratio is generally more accurate for mature companies and is particularly accurate for those industries that are asset-heavy (manufacturing, industrials, etc.).
In addition, the P/B ratio is typically avoided for companies comprised mostly of intangible assets (software companies).
In reality, very rarely is a company’s book value of equity lower than its market value of equity. If a firm’s market value is lower than its book value of equity, the market does not think the company is worth what it is recorded as on its accounting books.
5. Price To Earnings Ratio
On this list of the top 10 financial ratios, the P/E ratio comes in at number five. A price-to-earnings ratio, or P/E ratio, is the measure of a company’s stock price about its earnings. Which industries are overvalued or underpriced can be determined using the P/E ratio. It can also assist in price comparisons between businesses operating in related industries.
Many factors decide the P/E ratio of a company. We have covered this topic at length in our mindset writeup ” The Price To Earnings Paradox“. Click here to read.
The Price To Earnings Ratio is a lower the better metric.
It is generally agreed upon that a lower value is preferable for investors. A good P/E ratio isn’t necessarily a high or low ratio on its own. The market average P/E ratio currently ranges from 20 to 25, so a higher PE above that could be considered bad, while a lower PE ratio could be considered better to spot an underpriced stock.
6. Price To Sales Ratio
The price-to-sales ratio (PSR ratio) indicates how much an investor pays for a share compared to the sales a company generates per share. It measures the value placed on sales by the market.
For example, if the price-to-sales ratio is 5, investors are paying ₹5 for every ₹1 in sales. However, the value of the ratio varies across industries. A better benchmark is to compare with the industry average.
From an investment perspective, a low price-to-sales ratio (1.0 or less) may indicate a good buy with a stock price that is undervalued. Higher price-to-sales (P/S) ratios, such as 2.0 to 3.0, display a powerful market price and possibly an equally strong company if justified by supporting reasons.
The Price To Sales ratio is a lower the better metric.
As a common consensus, the lower the P/S, the better the value is. The price-to-sales ratio values a stock relative to its historical performance, market competitors, or general market.
In general, a low price-to-sales ratio means a good investment because investors are paying less for each unit of sales. On the other hand, price-to-sales can occasionally provide very little insight because it excludes any costs or debt, therefore a company with high sales may not always turn out to be profitable.
7. Profit Margin Ratio
Profit margin ratios are valuable when assessing a company’s overall financial health; for this reason, it is ranked seventh on this list of top 10 financial ratios. Profit margin is the ratio of profit remaining from sales after all expenses have been paid.
In corporate finance, the Profit margin is also recognized as the profit margin ratio, gross profit ratio, and sales ratio pivoting on specific considerations. A company’s profit margin ratio can show how well the company is managing its overall finances.
The Profit Margin Ratio is a higher the better metric.
Investors use this ratio to measure how effectively a company can convert sales into net income. Investors want to make sure profits are high enough to distribute dividends. An extremely low profit margin would indicate the expenses are too high and the management needs to budget and cut expenses.
This ratio also indirectly measures how well a company manages its expenses relative to its net sales. That is why companies strive to achieve higher ratios. They can do this by either generating more revenues while keeping expenses constant or by keeping revenues constant and lowering expenses.
Since most of the time generating additional revenues is much more difficult than cutting expenses, executives generally tend to reduce spending budgets to improve their profit ratio. Like most profitability ratios, this ratio is best used to compare like-sized companies in the same industry. This ratio is also effective for measuring the past performance of a company.
8. Dividend Payout Ratio
The dividend payout ratio, which ranks eighth on this list of the best financial ratios, is a crucial part of ratio analysis. The Dividend Payout Ratio is the number of dividends paid to shareholders about the total amount of net income the company generates.
In other words, the dividend payout ratio measures the percentage of net income that is distributed among shareholders in the form of dividends. Dividend payout ratios tend to vary by industry. Companies that operate in developed, slower-growing sectors that generate lots of relatively steady cash flow can have higher dividend payout ratios. They don’t need to retain as much money to fund their business for things like opening new stores or building another plant.
Don’t we all adore dividends? However, paying out excessive dividends can occasionally be a harmful practice that hinders a company’s long-term growth. A dividend payment ratio between 30 and 50 percent is generally regarded as healthy, whereas anything beyond 50 percent is seen as unsustainable over the long term.
This makes the dividend payout ratio a situational metric.
Many beginner investors buy stocks with the highest dividend yields they can find. They speculate that the higher yield will enable them to earn higher returns. But, that’s not always the case. Many stocks with high yields also have a high dividend payout ratio. This might put them in danger of having their payout cut if the economy worsens.
9. Price To Free Cashflow Ratio
The Price to Free Cashflow Ratio, one of the most important ratios, is ranked ninth among the top financial ratios. The price to free cash flow is a metric that is used to evaluate and compare a company’s market price of a single share with its per-share price of free cash flow (FCF).
Free cash flow (FCF) is the money a company has left from revenue after paying all its financial obligations; defined as operating expenses plus capital expenditure; during a specific period, such as a fiscal quarter.
Free Cash flow is the cash a company is free to use for discretionary spending, such as investing in business expansion or building financial reserves.
Price to free cash flow is a lower the better metric.
A low price to free cash flow indicates that the company’s market cap is low relative to the free cash flow it generates. A higher ratio suggests that the market capitalization is high relative to the free cash flow generated by the company.
Please note that Price-to-free cash flow can be manipulated on financial statements by conserving cash or deferring purchases. Therefore, it is preferable to combine this ratio with additional measurements.
10. Return On Equity Ratio
The return on equity ratio is number 10 on our list of the top financial ratios. The return on equity ratio or ROE is a profitability ratio that measures the ability of a firm to generate profits from its shareholder’s investments in the company.
In simple terms, the return on equity ratio shows how much profit each rupee of common stockholders’ equity generates. For example, an ROE of 1 means that every rupee of common stockholders’ equity generates 1 rupee of net income.
This is an important measurement for potential investors because they want to see how efficiently a company will use its money to generate net income. ROE is also an indicator of how effective management is at using equity financing to fund operations and grow the company.
Investors prefer a high return on equity ratio as this indicates that the company is using its investor funds effectively.
The return on equity ratio is higher the better metric.
It’s a higher the better metric and as a common consensus, companies that post an ROE of more than 15 percent are generally considered to be in good shape. Higher ROE ratios are almost always better than lower ratios but they have to be compared to other companies’ ratios in the industry. Since every industry has different levels of investors and income, ROE can’t be used to compare companies outside of their industries very effectively for ratio analysis.
Conclusion
Although ratio analysis is not flawless, it still performs a very important function when undertaking fundamental analysis. Some flaws in ratio analysis that are frequently noticed are:
💬 The information used is historical and is not current.
💬 The approach does not take into account external factors such as a worldwide recession or nasty pandemics.
💬 Ratio analysis does not measure the human element of a company.
While ratios may not be the only reliable method for selecting top stocks, they can undoubtedly support the conclusions of thorough financial research. This accelerates the process of putting together wise investing choices.
🔔 Investing is expensive, but leaving comments on this blog is free!