
Investing can be tricky, especially when the market gets bumpy. In this blog post, we want to help you learn some smart strategies to not only survive during market corrections but do well when things are uncertain in the investment world. We’ll be here to guide you through the ups and downs, so let’s dive in and discover the strategies that will help your investments stay on track!
The Context
For many investors in the accumulation phase, understanding the value of market corrections is crucial.

Despite being dreaded by most, market corrections are beneficial for long-term investment strategies. Unfortunately, this fear of market corrections is often exacerbated by attention-seeking individuals and sensationalized media.
The stock market is a highly emotional entity that can swiftly react to various stimuli, including shifts in economic conditions, corporate earnings, geopolitical events, investor sentiment, market speculation, and global macroeconomic factors. Specifically, market fluctuations may occur due to overvaluation, negative economic indicators like sluggish GDP growth, surging inflation, or rising interest rates. Additionally, market sentiment, often influenced by external events or market volatility, can trigger corrections as investors panic and sell off stocks.
Furthermore, global events such as trade disputes, political instability, or natural disasters can impact the market as well.
Instead of succumbing to fear, investors in the accumulation phase should view corrections as opportunities. These downturns provide a chance to acquire stocks at lower prices, potentially leading to higher returns in the long run. By maintaining a calm and rational approach during market corrections, investors can navigate through the turbulence and position themselves for future growth.
So, rather than fearing market corrections, investors should embrace them as part of the natural ebb and flow of the stock market. By understanding their significance and adopting a long-term perspective, investors can harness the power of corrections to further their investment goals.
If someone asks for a crystal ball to predict the future of the stock markets, the honest answer is that even the investment experts are not certain. The future is inherently uncertain, and accurate predictions are elusive. Instead of attempting to forecast the future, a wiser approach is to draw insights from historical observations and make mindful decisions while considering a range of potential outcomes.
Those who possess a statistical advantage tend to fare better during market corrections. That’s why we offer our readers the opportunity to learn from historical patterns that can help shape the unknown into a well-structured investment strategy. By comparing the present with past events and leveraging statistical advantages, investors can position themselves for success even in uncertain times.
Befriending Volatility
A close study of historic market panics and downturns reveals that no two dips are the same. However, with a structured approach, patterns can be identified to categorize them as follows:
≡ Pullback: A temporary decline in stock prices, typically ranging from 5% to 10% from recent highs.
≡ Correction: A more significant decline in stock prices, usually ranging from 10% to 20% from recent highs.
≡ Crash: A severe and rapid decline in stock prices, often exceeding 20% and accompanied by panic selling and significant market turmoil.
It’s important to note that these definitions are not fixed and can vary depending on market conditions and historical context.
While pullbacks and crashes are infrequent occurrences that can either be brief or uncontrollable, corrections are more commonplace but often evoke fear and uncertainty among investors. These market declines can lead to dilemmas and create a sense of unease, making them a challenging phenomenon to navigate.
Revealing the Past
The Nifty 50 index was launched on April 22, 1996, with a base value of 1,000. Since then, the Nifty 50 index has been corrected by more than 10% 11 times as per historical data. Our study reveals some key references mentioned below:
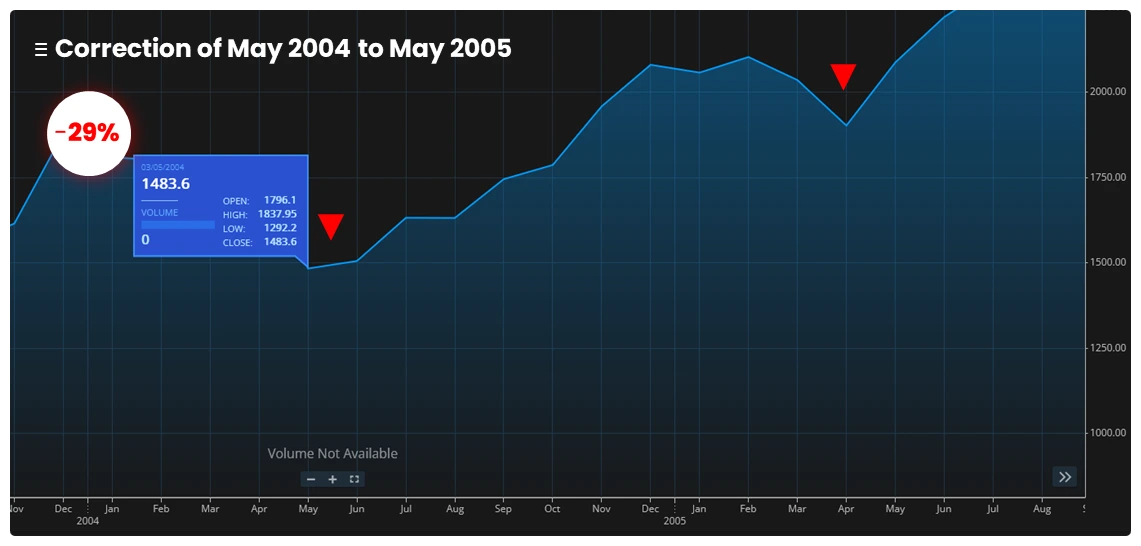
1. The Market Corrections of May 2004 to May 2005
During this period, the Nifty 50 index experienced a significant correction of 29%, triggered by a global sell-off and concerns about the Indian economy. It took approximately 14 months for the index to recover and reach its previous peak in July 2005, showcasing the resilience and cyclical nature of the market.
2. The Market Corrections of January 2008 to March 2009
During the tumultuous period of the global financial crisis, the Nifty 50 index experienced a staggering correction of 60%. It took approximately three years for the index to gradually recover, finally reaching its previous peak in November 2010.
This historical event serves as a reminder of the endurance of the market, despite challenging times.

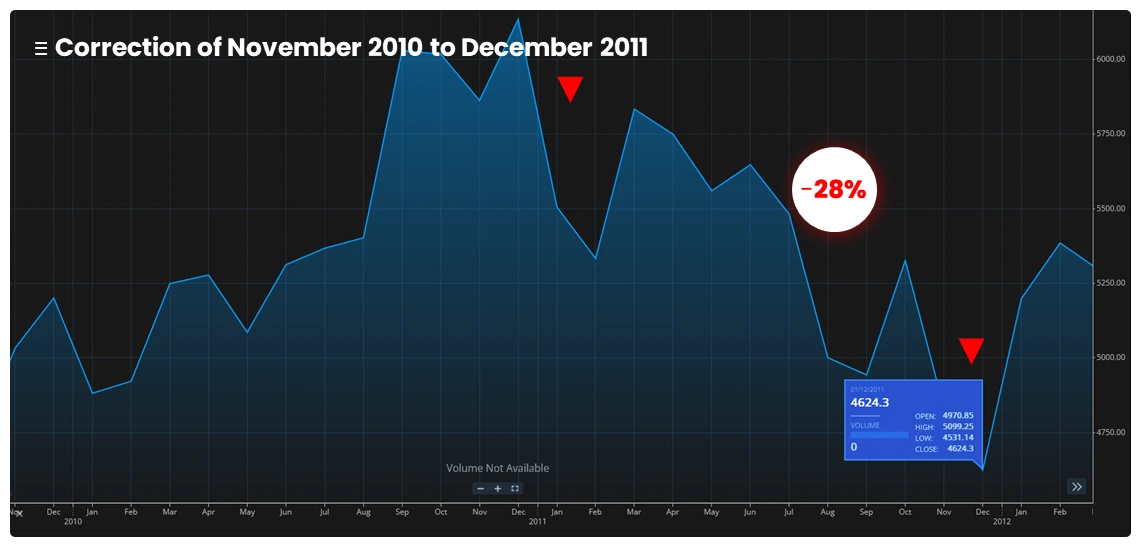
3. The Market Corrections of November 2010 to December 2011
During this period, the Nifty 50 index experienced a correction of 28% triggered by various factors such as high inflation, policy paralysis, and global economic uncertainty. However, the index rebounded relatively quickly, taking approximately one year to recover and reach its previous peak in November 2010.
This serves as an example of how markets can rebound and regain their momentum after periods of turbulence.
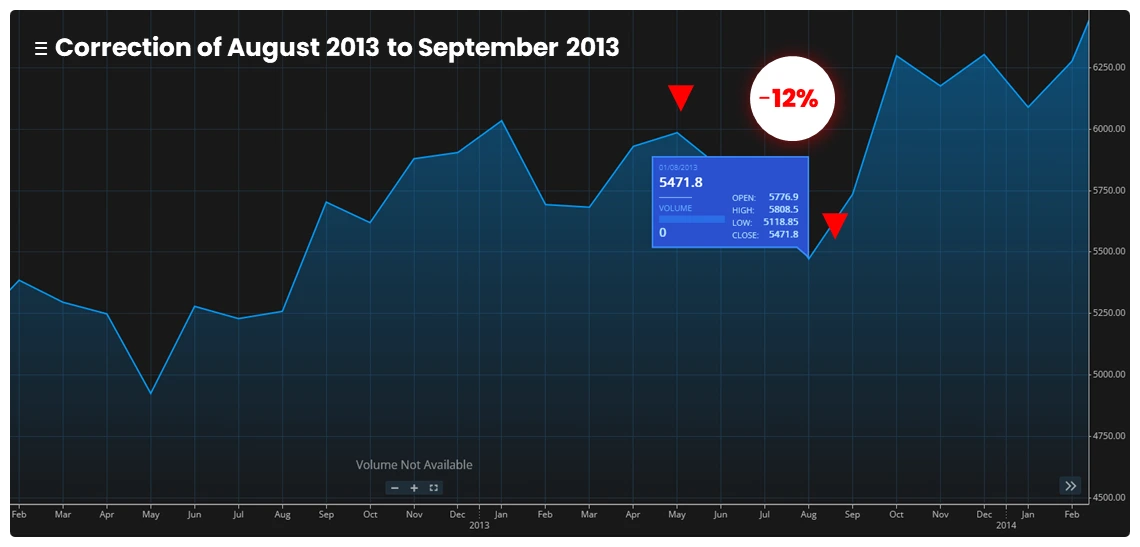
4. The Market Corrections of August 2013 to September 2013
During this period, the Nifty 50 index experienced a correction of 12% caused by concerns over the US Federal Reserve’s decision to taper its bond-buying program. However, the index rebounded relatively swiftly, taking approximately two months to recover and reach its previous peak in November 2013.
This event serves as a reminder of the dynamic and ever-changing nature of the market, with opportunities for recovery even after short-term downturns.
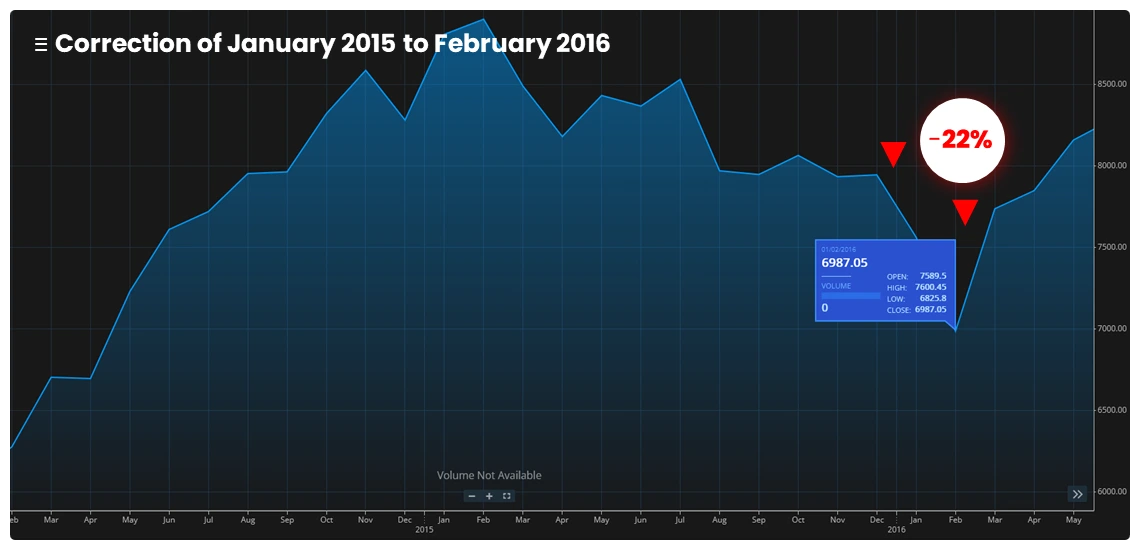
5. The Market Corrections of January 2015 to February 2016
During this period, the Nifty 50 index experienced a correction of 22% attributed to a global commodity rout and concerns over China’s economy. The index took approximately two years to recover and reach its previous peak in March 2017, serving as a testament to the resilience of the market and the potential for a rebound even after prolonged downturns.
This historical example highlights the importance of a long-term investment perspective and staying committed to a well-structured investment strategy.
6. The Market Corrections of August 2015 to February 2016
During this period, the Nifty 50 index experienced a significant correction of 20%, driven by a perfect storm of factors including a slowdown in the Chinese economy, falling commodity prices, and concerns over the health of the Indian banking sector. It was a challenging time for investors, but patience paid off as the index made a remarkable recovery in about 9 months, reaching its previous peak in September 2016.
This serves as a compelling example of the resilience and potential for a rebound in the face of market volatility. As investors, we can draw valuable lessons from such historical patterns to navigate the uncertain waters of the stock market with confidence and conviction.

7. The Market Corrections of February 2018 to March 2018
During this period, the Nifty 50 index experienced a correction of 10% fueled by rising bond yields and concerns over global trade tensions. However, the index demonstrated resilience and regained its footing, taking about 6 months to recover and reaching its previous peak in August 2018. This serves as a reminder that markets can experience short-term setbacks, but with a strategic approach and long-term perspective, opportunities for recovery and growth can arise.
As investors, we can learn from such historical events to stay focused on our investment goals and navigate market challenges with resilience.

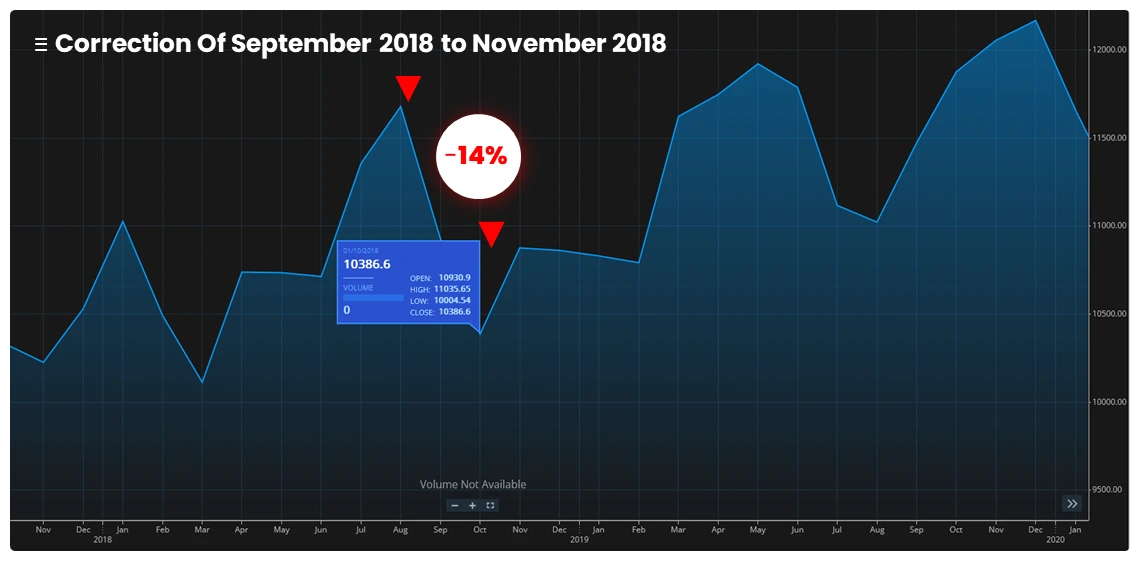
8. The Market Corrections of September 2018 to November 2018
During the autumn of 2018, the financial markets experienced a tumultuous ride as the Nifty 50 index faced a challenging phase. From September to October, a sharp correction of 14% gripped the index, triggered by a global sell-off and exacerbated by apprehensions about soaring crude oil prices and a weakening rupee.
However, after weathering the storm for about two months, the Nifty 50 showed its resilience by gradually rebounding and reclaiming its previous peak in November 2018.
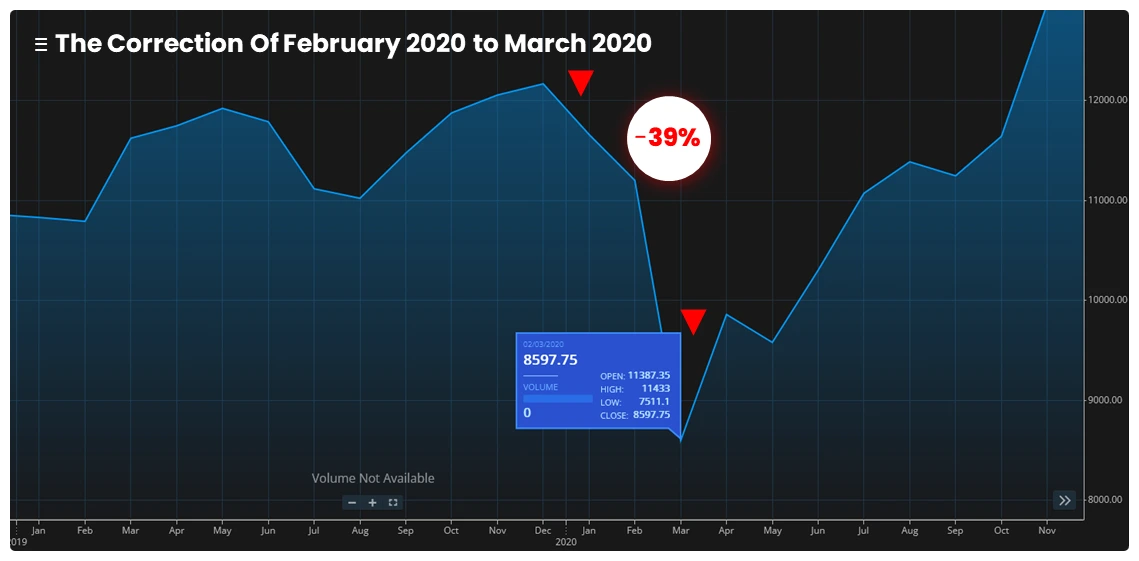
9. The Market Corrections of February 2020 to March 2020
In the early months of 2020, the financial markets were struck by a seismic event as the COVID-19 pandemic unleashed its devastating effects on the global economy. The Nifty 50 index, in particular, bore the brunt of this turmoil, undergoing a significant correction of 39% from February to March. The unprecedented challenges posed by the pandemic and its far-reaching repercussions sent shockwaves through the financial world, causing widespread uncertainty and panic.
However, despite the daunting obstacles, the Nifty 50 index showed resilience and gradually embarked on a slow but steady path to recovery. It took approximately eight months of navigating through uncertain waters before the index reclaimed its previous peak in November 2020, serving as a testament to the unwavering spirit and resilience of the financial markets in the face of unprecedented adversity.
Conclusion
Stock market corrections are a reality, and they can happen unexpectedly, with past performance not necessarily predicting future results. As per our study, the recovery times after a correction of over 10% for the Nifty 50 index have averaged around 15 months, with duration varying based on factors such as severity, underlying economic and political conditions, and global macroeconomic conditions.
If you take heed from the lessons of history you can refine your investment strategies, and navigate through market storms to unearth stocks at bargain prices. Instead of fearing corrections, see them as opportunities to seize value and reap rewards.
PlanB Financials’ mission is to provide you with the knowledge and resources you need to reach your financial objectives. We hope you enjoyed this post.
🔔 Investing is expensive, but leaving comments on this blog is free!
Invest wisely!